

As sellers outnumber buyers by a historic margin, the US housing market faces unprecedented challenges and opportunities.
59+ Sources
- 1.Key Market Insights for Mid-2025
- 2.The Unprecedented Seller-Buyer Imbalance
- 3.National Market Trends and Metrics
- 4.Regional Variations: A Tale of Two Markets
- 5.Visualizing Market Dynamics
- 6.Understanding the “Frozen” Housing Market
- 7.Key Market Indicators: A Snapshot Table
- 8.Navigating the Shifting Sands: A Mind Map of Market Influences
- 9.What This Means for the Future
- 10.A Visual Deep Dive: The Shifting Housing Market
- 11.Frequently Asked Questions (FAQ)
- 12.Conclusion
- 13.Recommended Further Exploration
- 14.Referenced Search Results
Key Market Insights for Mid-2025
- Historic Imbalance: The US housing market is experiencing a record disparity, with over 500,000 more active sellers than buyers as of June 2025, signaling a significant shift from recent seller-dominated conditions.
- Affordability Hurdles Persist: Despite increasing inventory, high mortgage rates (hovering around 7%) and elevated home prices continue to pose substantial affordability challenges, deterring potential buyers and contributing to subdued demand.
- Regional Divergence: While some areas, particularly in the Northeast and Midwest, maintain more balanced or seller-friendly conditions, markets in the South and West are cooling rapidly, experiencing higher inventory growth and increased price reductions.
The U.S. housing market in mid-2025 is undergoing a profound transformation, moving away from the intense seller-dominated environment of recent years. The current landscape is defined by a significant and widening gap between the number of active sellers and prospective buyers. This imbalance, reaching over half a million more sellers than buyers by June 2025, represents the widest such disparity ever recorded. This shift is primarily driven by persistent affordability challenges, elevated mortgage rates, and evolving demographic trends, collectively keeping a substantial portion of potential buyers on the sidelines.
This dynamic has reshaped market expectations, indicating potential downward pressure on home prices if buyer demand does not rebound. While the market was previously characterized by severe inventory shortages, the pendulum has now swung, leading to a surplus of homes for sale. This section will delve into the multifaceted aspects of this rebalancing act, exploring the key national metrics, regional variations, and the underlying forces at play.
The Unprecedented Seller-Buyer Imbalance
A detailed look at the historic shift in market dynamics.
The most striking feature of the current U.S. housing market is the unprecedented gap between sellers and buyers. In June 2025, there were 508,715 more active sellers than buyers, a figure that marks the widest recorded divergence. This trend has been building throughout the year, with reports from April and May already showing nearly 500,000 more sellers than buyers. This significant surplus of listings over active demand is a clear indicator of a market transition.
Contributing Factors to the Imbalance
- High Mortgage Rates: With mortgage rates consistently around 7%, the cost of borrowing remains a major deterrent for prospective buyers. This “higher-for-longer” interest rate environment significantly impacts affordability, even for those with stable incomes.
- Elevated Home Prices: Despite some softening, overall home prices remain elevated, making homeownership out of reach for many, particularly first-time buyers. The median home-sale price was around $422,800 in May 2025, a substantial figure that, combined with high rates, stretches budgets to their limits.
- Economic Uncertainty: Broader economic uncertainties, including inflation concerns and job market fluctuations, contribute to buyer hesitation. Many are opting to wait for more favorable conditions, hoping for either price reductions or a significant dip in mortgage rates.
- Increased Inventory: The supply of homes on the market has been steadily increasing. Total unsold homes, including those under contract, were up 16.9% year-over-year in July 2025, with inventory hitting a new post-pandemic high. This growing supply, coupled with reduced demand, exacerbates the seller-buyer gap.
National Market Trends and Metrics
Dissecting the core indicators of the US housing landscape.
The national housing market in mid-2025 presents a complex picture of slowing growth, increasing supply, and persistent affordability challenges. Key metrics reveal a market in flux, undergoing a necessary rebalancing after years of rapid appreciation.
Home Prices: A Mixed Outlook
The trajectory of home prices is a critical indicator of market health. The average U.S. home value stands at approximately $368,581, showing a modest 0.3% to 0.5% increase over the past year. However, this national average masks significant variations and underlying pressures. The median sale price for new homes in June 2025 was $401,800, notably lower than both May 2025 and June 2024 figures, indicating a monthly decline of about 4.9%. Experts hold differing views on future price movements:
- Some forecasts suggest continued moderate price growth, albeit at a much slower pace than in previous years.
- Others predict a slight decline, with Zillow projecting a -1.7% drop between March 2025 and March 2026, though a more recent forecast indicates a potential slight rise of +0.4% between July 2025 and July 2026.
Historically, a market where sellers significantly outnumber buyers tends to lead to downward pressure on prices. This is evident in the increasing prevalence of price reductions, with 25.6% of homes for sale in June having their prices cut, more than double the rate observed in 2021.
Inventory Levels: A Surge in Supply
Inventory is a crucial factor influencing market dynamics. The supply of homes has seen a notable increase, challenging the long-standing narrative of inventory shortages. Active listings reached a post-pandemic high in July, up 16.9% year-over-year, and total inventory (including homes under contract) rose by 16.9% year-over-year in July 2025. In April 2025, inventory saw a 30.6% year-over-year increase, marking the 18th consecutive month of growth. While overall inventory remains 13.4% below pre-pandemic levels nationally, some regions are seeing a quicker recovery, with 12 states now exceeding their pre-pandemic inventory levels by Q2 2025.
Sales Activity: A Slowdown in Transactions
The high borrowing costs and affordability constraints have significantly dampened sales activity. Existing home sales remain at near 30-year lows, and new home sales also dropped considerably, with May 2025 experiencing a 13.7% decrease. Homes are also taking longer to sell, with the median time on market in June 2025 being 27 days, up from 22 days in June 2024. A notable trend is the increase in home purchase agreements falling through, with nearly 15% of contracts collapsing in June 2025.
Mortgage Rates and Affordability: The Persistent Hurdle
Mortgage rates are arguably the single most impactful factor dampening buyer demand. They are expected to remain elevated, “bouncing around” 7% for much of 2025. While some predictions suggest a slight ease to 6.7% by year-end, or even a dip to 5.5% for 15-year loans in the latter half of 2025, the current rates, combined with high prices, create an affordability crisis for many. This environment has led to a “frozen” housing market, where potential buyers are unable or unwilling to transact.
Regional Variations: A Tale of Two Markets
How different parts of the country are experiencing the market shift.
The U.S. housing market is not a monolith; regional variations are stark, with some areas experiencing significant cooling while others remain relatively tight. This divergence is primarily influenced by existing inventory levels, economic conditions, and demographic shifts within each region.
Cooling Markets: South and West
The South and West are experiencing the most pronounced cooling, with markets in these regions softening rapidly. States like Florida, Texas, Arizona, and Nevada, along with parts of California, have seen the most substantial increases in inventory. This is partly due to a higher volume of new construction in these areas, particularly in the Sun Belt, which now accounts for a larger share of available stock. Consequently, these regions are witnessing more frequent price cuts and longer days on market. Cities like Las Vegas, in particular, are seeing some of the fastest price declines.
Stable Markets: Northeast and Midwest
In contrast, the Northeast and Midwest are maintaining more balanced or even seller-friendly conditions. Active listings in many metros within these regions remain below 2019 levels. Competition is firmer, and prices are holding up better, although the pace of price appreciation has slowed, and homes are still taking longer to sell compared to recent years. These regions generally have tighter inventory and less new construction, contributing to their relative stability.
New Construction vs. Existing Homes
A significant trend is the increasing share of new construction in the available housing supply. This offers buyers more options and often greater leverage, especially with builders who may offer incentives to move inventory. This contrasts with existing home sellers, who may be less willing to negotiate on price or terms, having potentially purchased or refinanced at lower interest rates.
Visualizing Market Dynamics
Understanding the trends through illustrative charts.
To better grasp the nuanced state of the market, let’s visualize some of the key forces at play. The following charts provide a comparative overview of current market sentiment and regional inventory shifts.
Market Sentiment Radar Chart
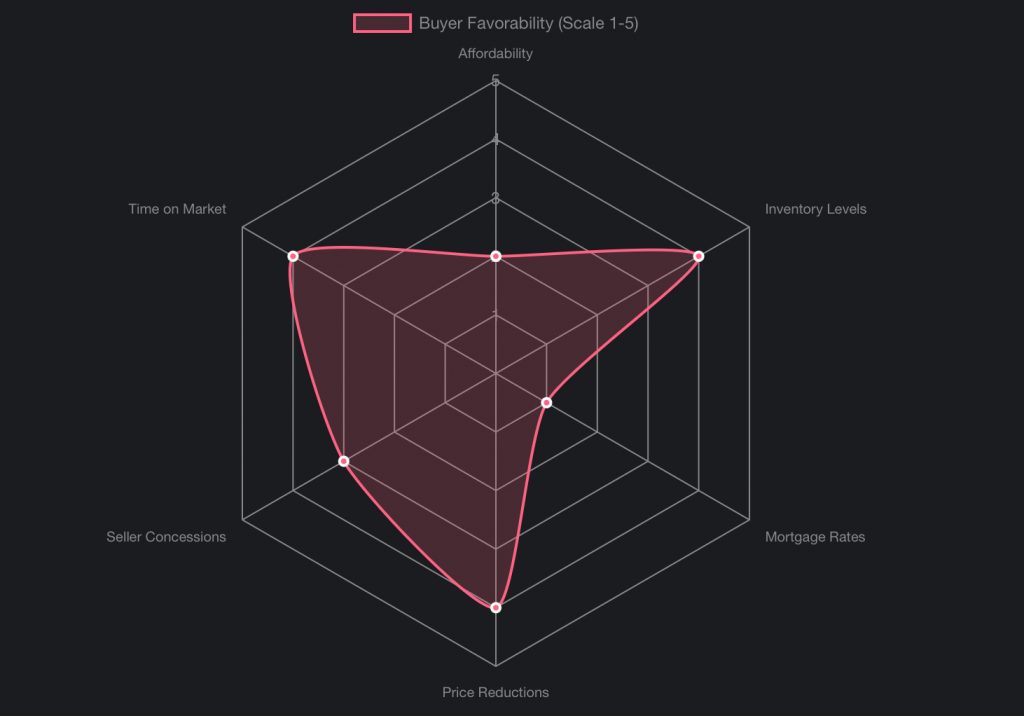
This radar chart illustrates the perceived strength of various market factors from a buyer’s perspective. A higher score indicates a more favorable condition for buyers, while a lower score suggests challenges.
Regional Inventory Growth Bar Chart
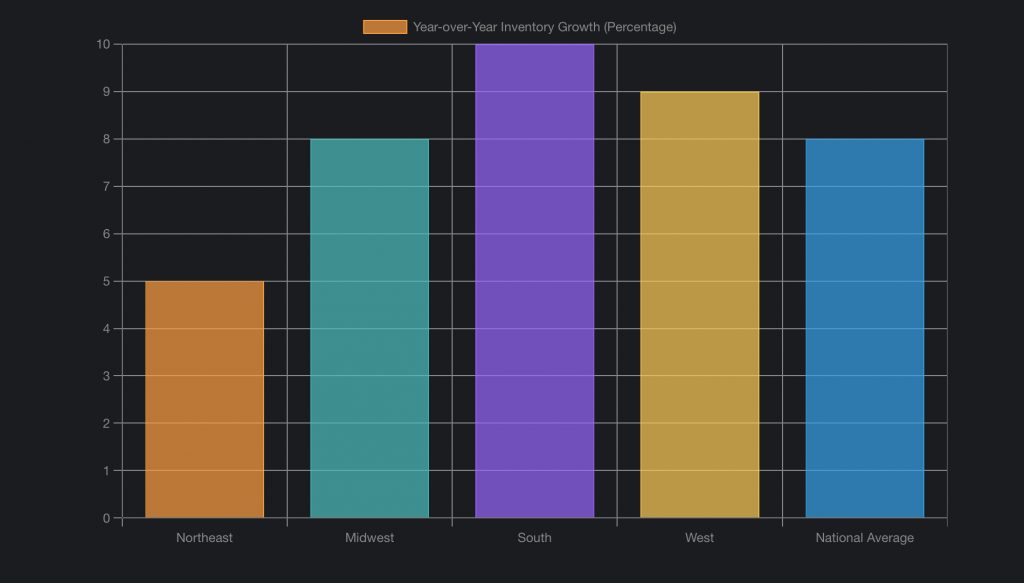
This bar chart compares the year-over-year inventory growth across different U.S. regions, highlighting where supply is increasing most significantly.
Understanding the “Frozen” Housing Market
Why transactions are slowing despite rising inventory.
The term “frozen” housing market aptly describes the current state, where transactional velocity has significantly decreased. Despite an increasing supply of homes, the market is not experiencing a surge in sales. This phenomenon is largely attributable to an affordability crisis and a standoff between buyers and sellers.
The Affordability Crisis and Demographics
The primary driver of the “frozen” market is the ongoing affordability crisis. With median incomes around $84,000 against high home prices and near-7% mortgage rates, the financial burden of homeownership remains prohibitive for many. This particularly impacts younger demographics, such as millennials, who are often first-time buyers but are increasingly delaying purchases due to these economic hurdles. While baby boomers constitute a significant portion of buyers, their activity alone cannot offset the broader demand-side challenges.
Buyer Behavior and Market Expectations
Many prospective buyers are adopting a wait-and-see approach, hoping for more significant price drops or a substantial reduction in mortgage rates. This hesitation, coupled with economic uncertainties, has led to a noticeable slowdown in home sales. The increase in contracts falling through—nearly 15% in June 2025—further underscores this buyer reticence and the underlying fragility of current deals.
Key Market Indicators: A Snapshot Table
A consolidated view of essential market data points.
The table below summarizes critical national housing market indicators as of mid-2025, providing a quick reference to the prevailing conditions:
| Indicator | Current Status (Mid-2025) | Implication |
|---|---|---|
| Seller-Buyer Gap | 508,715 more sellers than buyers (June) | Record imbalance, favoring buyers in terms of choice |
| Average Home Value | ~$368,581 (up 0.3% YoY) | Price growth significantly slowed; some markets seeing declines |
| Median Home Sale Price | $422,800 (May); New homes $401,800 (June) | Varied trends, new homes showing price softening |
| Mortgage Rates (30-year fixed) | Hovering around 7% | Major affordability barrier, keeping buyers sidelined |
| Total Inventory Growth (YoY) | Up 16.9% (July) | Increasing supply, but still below pre-pandemic levels nationally |
| Price Reduction Share | 25.6% of listings (June) | Sellers increasingly willing to cut prices to attract buyers |
| Median Time to Sell | 27 days (June) | Homes taking longer to sell, extended market exposure |
| Existing Home Sales | Near 30-year lows | Demand significantly suppressed |
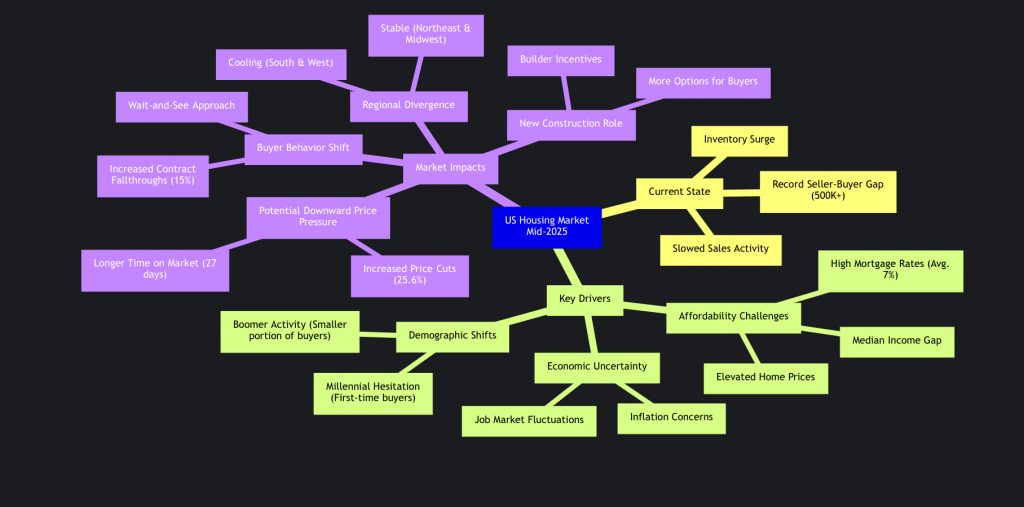
Navigating the Shifting Sands: A Mind Map of Market Influences
Visualizing the interconnected factors shaping the 2025 housing market.
The U.S. housing market is influenced by a complex interplay of economic, demographic, and behavioral factors. This mind map visually breaks down these interconnected elements, highlighting how each contributes to the current market dynamics.
mindmap
root[“US Housing Market Mid-2025”]
Current_State[“Current State”]
Seller_Buyer_Gap[“Record Seller-Buyer Gap (500K+)”]
Inventory_Surge[“Inventory Surge”]
Slowed_Sales[“Slowed Sales Activity”]
Key_Drivers[“Key Drivers”]
Affordability_Challenges[“Affordability Challenges”]
High_Mortgage_Rates[“High Mortgage Rates (Avg. 7%)”]
Elevated_Home_Prices[“Elevated Home Prices”]
Median_Income_Gap[“Median Income Gap”]
Economic_Uncertainty[“Economic Uncertainty”]
Inflation_Concerns[“Inflation Concerns”]
Job_Market_Fluctuations[“Job Market Fluctuations”]
Demographic_Shifts[“Demographic Shifts”]
Millennial_Hesitation[“Millennial Hesitation (First-time buyers)”]
Boomer_Activity[“Boomer Activity (Smaller portion of buyers)”]
Market_Impacts[“Market Impacts”]
Price_Pressure[“Potential Downward Price Pressure”]
Increased_Price_Cuts[“Increased Price Cuts (25.6%)”]
Longer_Time_on_Market[“Longer Time on Market (27 days)”]
Regional_Divergence[“Regional Divergence”]
Cooling_South_West[“Cooling (South & West)”]
Stable_Northeast_Midwest[“Stable (Northeast & Midwest)”]
Buyer_Behavior_Shift[“Buyer Behavior Shift”]
Wait_and_See_Approach[“Wait-and-See Approach”]
Increased_Contract_Fallthroughs[“Increased Contract Fallthroughs (15%)”]
New_Construction_Role[“New Construction Role”]
More_Options_for_Buyers[“More Options for Buyers”]
Builder_Incentives[“Builder Incentives”]
What This Means for the Future
Outlook for buyers, sellers, and the broader real estate landscape.
The current market conditions suggest a continued period of rebalancing, with potential implications for both buyers and sellers in the months ahead. The market is transitioning from a period of severe inventory shortages to one with an increasing surplus, suggesting a return to more normalized conditions, though not without challenges.
Outlook for Buyers
Buyers are gaining leverage in many markets, particularly in the South and West, due to increased inventory and sellers’ growing willingness to negotiate. This leverage may lead to more favorable pricing and terms. However, affordability remains a significant hurdle, as high mortgage rates continue to impact purchasing power. Buyers who can navigate these rates or wait for potential dips in interest rates may find more opportunities. The availability of new construction also provides additional choices and potential for incentives.
Outlook for Sellers
Sellers are facing a more challenging environment. The days of multiple offers and rapid sales are largely over in most regions. Sellers must now strategically price their homes, consider concessions (such as covering closing costs or offering rate buydowns), and be prepared for longer listing times. Some sellers are opting to delist their homes rather than accept lower offers, which could further impact future supply dynamics. For those who must sell, flexibility and a realistic approach to pricing are paramount.
Long-Term Market Predictions
The housing market is expected to remain challenging in the near term, with prices likely to stabilize or decline slightly in many areas. Existing home sales are predicted to remain subdued through 2025, potentially increasing slowly through 2030 as mortgage rates gradually decline. While some experts point to a “correction” rather than a “crash,” the current environment necessitates a cautious approach for all market participants.
A Visual Deep Dive: The Shifting Housing Market
Exploring the dynamics through a relevant video perspective.
To further illustrate the shifting dynamics discussed, here’s a relevant video that provides additional insights into the changing landscape of the housing market in 2025.
This video, titled “The 2025 Housing Market Just Shifted MASSIVELY! Great News for Buyers!”, highlights the significant market shift being reported, particularly by Redfin, and frames it as potentially positive for buyers. It delves into the implications of increased inventory and the growing seller-buyer gap, discussing how these changes are creating opportunities that were not present in previous years. The video’s perspective complements our analysis by offering a direct, expert-driven view on how these shifts might impact market participants, especially those looking to buy.
Frequently Asked Questions (FAQ)
What is the main reason for the current seller-buyer imbalance in the US housing market?
The primary reasons are high mortgage rates (around 7%), elevated home prices, and economic uncertainties keeping potential buyers on the sidelines, while inventory, including new constructions, continues to grow.
Are home prices expected to drop significantly in 2025?
While forecasts vary, the consensus points to prices stabilizing or declining slightly in many areas, particularly in cooling markets like the South and West. Significant widespread drops are not broadly predicted, but increasing price reductions are already common.
Which regions are more favorable for buyers versus sellers right now?
Markets in the South and West are generally becoming more buyer-friendly due to higher inventory growth and increased price reductions. The Northeast and Midwest, however, remain relatively tighter and more seller-friendly, though price growth has slowed.
How do high mortgage rates affect the housing market?
High mortgage rates significantly reduce buyer affordability and purchasing power, leading to lower demand, fewer sales, and a “frozen” market where many potential buyers are hesitant to enter.
What should sellers do in the current market conditions?
Sellers should price their homes competitively, be prepared for longer listing times, and consider offering concessions (like covering closing costs) to attract buyers. Flexibility and a realistic approach to current market value are key.
Conclusion
The U.S. housing market in mid-2025 is undergoing a notable rebalancing, characterized by a historic seller-buyer imbalance. While challenges like high mortgage rates and affordability issues persist, increasing inventory and a slowing pace of price appreciation indicate a shift towards a more normalized market, particularly in some regions. This evolving landscape offers new dynamics for both buyers and sellers, demanding adaptability and strategic decision-making in navigating the path ahead.
Recommended Further Exploration
- How do future interest rate changes impact long-term housing market forecasts?
- What are the best strategies for first-time homebuyers navigating a market with increasing inventory?
- Which regional economic factors are most influential in the divergence of housing market conditions?
- How do trends in new construction sales compare to existing home sales, and what does this mean for inventory?
Referenced Search Results
redfin.com
The U.S. Housing Market Has Nearly 500,000 More Sellers Than Buyers—the Most on Record – Redfin
resiclubanalytics.com
Zillow turns housing bear—just look at its updated 2025 forecast – ResiClub Analytics
jpmorgan.com
The Outlook for the U.S. Housing Market in 2025 – J.P. Morgan
realtor.com
July 2025 Monthly Housing Market Trends Report – Realtor.com
zillow.com
United States Housing Market: 2025 Home Prices & Trends – Zillow
realestate.usnews.com
2025-2030 Five-Year Housing Market Predictions – U.S. News
pbs.org
What experts are forecasting for renters and homebuyers this year – PBS
ramseysolutions.com
Housing Market Predictions For 2025 – Ramsey Solutions
fortune.com
The American housing market is in a deep freeze – Fortune
nytimes.com
U.S. Homes Are Not Selling, and Prices Continue to Rise – The New York Times
reddit.com
New Real-Estate Math: Half a Million More Sellers Than Buyers
housingwire.com
2025 could be the last year of inventory shortage
finance.yahoo.com
2025 housing market: Is it a good time to buy a house?
redfin.com
United States Housing Market & Prices | Redfin
virginiabusiness.com
More sellers than buyers in housing market slowdown – Virginia …
blog.reination.com
The State of U.S. Housing Inventory Q2 2025 – REI Nation
zillow.com
Zillow Home Value and Home Sales Forecast (July 2025)
nar.realtor
stocktitan.net
US Housing Market Milestone: West and South Lead 1M+ Inventory Recovery While Northeast Struggles
awealthofcommonsense.com
Is It Finally a Buyer’s Market in Housing? – A Wealth of Common Sense
virginiarealtors.org
4 Key Takeaways: 2025 Home Buyers and Sellers Generational …
fortune.com
There are 500,000 more people selling their homes in the U.S. than …
forbes.com
Housing Market Predictions For 2025: When Will Home Prices Drop? – Forbes Advisor
finance.yahoo.com
US housing market now has 500K more sellers than buyers — and …
davisvanguard.org
Opinion: We’re in a Housing Crisis – Davis Vanguard
fastcompany.com
Zillow changes course on home prices: Updated forecast for 400 …
investors.redfin.com
The U.S. Housing Market Has Nearly 500,000 More Sellers …
wsj.com
New Real-Estate Math: Half a Million More Sellers Than Buyers – WSJ
thestreet.com
Major housing expert predicts huge housing market reset in 2025 – TheStreet
livenowfox.com
Home sellers outnumber buyers by record amount: What that means …
reddit.com
r/REBubble on Reddit: Las Vegas Becomes the Fastest-Cooling Housing Market in 2025
morningstar.com
ramseysolutions.com
Housing Market Predictions for 2025 – Ramsey Solutions
realwealth.com
25+ Housing Market Predictions for the Next 5 Years [2025-2029]
calculatedriskblog.com
Watch Inventory and Why Measures of Existing Home Inventory appear Different
reddit.com
Home sellers now outnumber buyers by largest margin in 12 years
calculatedriskblog.com
Part 1: Current State of the Housing Market; Overview for mid-March 2025
reddit.com
Inventory is back to 2019 levels. Here’s what that means for 2025.
rismedia.com
Housing Inventory Up 32% in May, Easing Listings Crunch in Some Regions: Report
qz.com
There are almost half-a-million more home sellers than buyers right …
businessinsider.com
Here’s the latest stat showing how the US housing market has frozen over in 2025
zillow.com
Home values flatten as sellers outnumber buyers (March …
howeandrusling.com
2025 U.S. Housing Market Update: Affordability Crisis, Regional …
resiclubanalytics.com
12 states are back above pre-pandemic housing inventory levels
ramseysolutions.com
Housing Market Predictions for 2025 – Ramsey Solutions
realtor.com
July 2025 Monthly Housing Market Trends Report – Realtor.com
cnbc.com
Nearly one-third of major U.S. housing markets now see falling home prices
businesswire.com
The U.S. Housing Market Has Nearly 500,000 More Sellers Than …
coloradospringshomesearchnow.com
📉 The Real Colorado Springs Housing Crash? It Already Happened.
myoakleaf.com
Debunking the Housing Hype: Why “500,000 More Sellers Than …
pwc.com
Emerging Trends in Real Estate® 2025 – PwC
bankrate.com
Housing Market Predictions For The Rest Of 2025 | Bankrate
ramseysolutions.com
Housing Market Predictions for 2025 – Ramsey
axios.com
It’s a homebuyer’s market — if you can afford one
realtor.com
April 2025 Housing Market Trends Report—Realtor.com Research
nar.realtor
Home Buyers and Sellers Generational Trends
cnn.com
Home sellers now outnumber buyers by largest margin in 12 years …
newsweek.com
California faces pileup of unsold homes
housingwire.com
Inventory back to 2019 levels and what that means for 2025
blog.altosresearch.com
2025 Could Be the Last Year of Inventory Shortage
Last updated August 24, 2025