

The Harsh Realities of U.S. Renters and the Persistent Challenge of Housing Affordability in 2023 and Beyond
78+ Sources
- Key Insights into Renter Financial Strain
- Understanding the “Cost-Burdened” Definition
- The Pervasive Nature of Renter Cost Burden in 2023
- Key Factors Contributing to the Affordability Crisis
- Regional Variations in Affordability
- The Broader Context of the Housing Crisis
- Comparing Renter and Homeowner Burdens
- Key Statistics and Trends: 2023-2025 Outlook
- Frequently Asked Questions (FAQ)
- Conclusion
- Recommended Further Reading
- Referenced Search Results
Key Insights into Renter Financial Strain
- Nearly Half of All Renters Faced Cost Burden: In 2023, a staggering 49.7% of U.S. renter households, totaling over 21 million, were considered cost-burdened, dedicating more than 30% of their income to housing expenses. This marked a record high, underscoring a widespread affordability crisis.
- Median Income-to-Housing Cost Ratio Stagnates at 31%: The median income-to-housing cost ratio for renters in 2023 stood at 31.0%, indicating that, on average, renters spent nearly one-third of their income on housing. This figure remained consistent with 2022, despite significant increases in rental costs.
- Severe Burden and Disparities Among Vulnerable Groups: A substantial portion of these cost-burdened households, approximately a quarter, were severely cost-burdened, spending over 50% of their income on housing. This burden disproportionately affected lower-income households and specific demographic groups, such as Black and Hispanic renter households.
Your statement accurately reflects the challenging reality faced by millions of renters across the United States. The year 2023 was indeed a landmark for housing affordability, with nearly half of all American renter households classified as “cost-burdened.” This means they allocated over 30% of their gross income to housing expenses, a threshold widely recognized as a sign of financial strain. The median income-to-housing cost ratio, standing at 31%, further emphasizes the severity of this issue, indicating that for the average renter, nearly a third of their earnings went directly towards keeping a roof over their heads.
Understanding the “Cost-Burdened” Definition
What Does It Mean to Be Cost-Burdened?
The concept of “cost-burdened” is not arbitrary; it’s a standard established by the U.S. Department of Housing and Urban Development (HUD) to identify households experiencing financial stress due to housing costs. A household is defined as:
- Cost-burdened: Spending more than 30% of their income on housing costs.
- Severely cost-burdened: Spending more than 50% of their income on housing costs.
These definitions provide a critical framework for assessing the scope and severity of housing affordability challenges. In 2023, approximately 49.7% of renter households, which translates to over 21 million households, fell into the cost-burdened category. Alarmingly, about a quarter of these households were severely cost-burdened, indicating extreme financial vulnerability.

Illustration depicting the breakdown of housing expenses for renters.
The Pervasive Nature of Renter Cost Burden in 2023
Record Highs and Unchanged Median Ratios
The year 2023 witnessed a record number of cost-burdened renter households. Despite significant annual real increases in rental costs—the largest since at least 2011—the median share of renter income spent on rent and utilities remarkably remained at 31.0%, unchanged from 2022. This stability in the median ratio, despite rising rents, suggests a complex interplay of factors, including potential income growth among some renters or a shift in the renter demographic to include higher-income households. However, this does not diminish the profound impact on those struggling to meet their housing obligations.
Disparities and Vulnerable Populations
The burden of high housing costs is not evenly distributed. Lower-income households and certain racial and ethnic groups face disproportionately higher rates of cost burden. For instance, in 2023:
- 56.2% of Black renter households were cost-burdened, with about 30% severely burdened.
- Hispanic renter households also experienced significantly higher rates of cost burden.
This highlights systemic inequities within the housing market, where vulnerable populations are consistently more susceptible to financial hardship due to housing expenses.
Key Factors Contributing to the Affordability Crisis
Rising Housing Costs vs. Stagnant Wages
A primary driver of the housing affordability crisis is the persistent imbalance between rising housing costs and stagnant wage growth. For the past two decades, housing expenses have generally outpaced income increases, making it increasingly difficult for renters to find affordable housing options. This trend is exacerbated by a shortage of affordable housing units, further driving up demand and, consequently, prices.
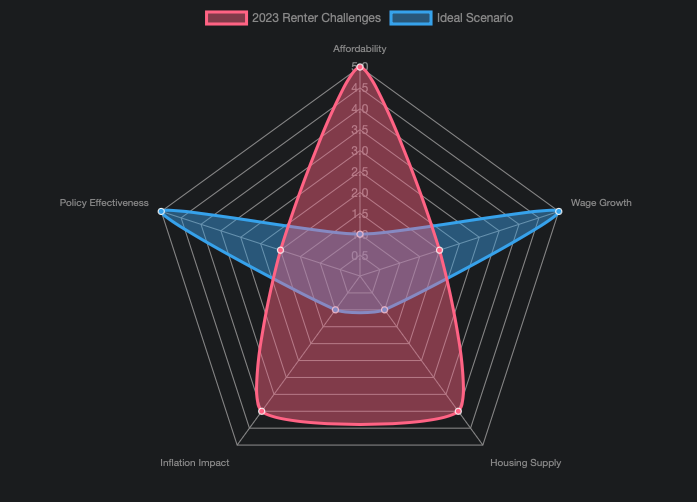
This radar chart visually represents key factors influencing renter affordability. “Affordability” and “Inflation Impact” are high for “2023 Renter Challenges,” indicating significant issues, while “Wage Growth,” “Housing Supply,” and “Policy Effectiveness” are low, pointing to areas where current conditions fall short of ideal. Conversely, the “Ideal Scenario” dataset shows the desired state for each factor, highlighting the stark contrast with current realities.
Market Dynamics and Data Interpretation
It’s important to differentiate between various data sources when discussing rent-to-income ratios. Industry datasets, such as those focusing on market-rate, newly signed leases, often show lower rent-to-income ratios (e.g., 22-24%). This is because these analyses often exclude lower-income and subsidized renters and primarily reflect higher-income cohorts entering new leases. In contrast, surveys like the American Community Survey (ACS) by the U.S. Census Bureau capture the full renter population and include utilities, leading to a higher median ratio (e.g., 31%). This distinction is crucial for a comprehensive understanding of the crisis.
Regional Variations in Affordability
Geographic Hotspots and More Manageable Markets
Housing affordability is not uniform across the United States. The severity of the cost burden varies significantly by state and metropolitan area. States like California and Florida consistently report higher shares of cost-burdened renters, driven by high housing costs and competitive markets. In contrast, states such as the Dakotas and Iowa tend to have lower rates of cost-burdened renters, offering relatively more affordable housing options.
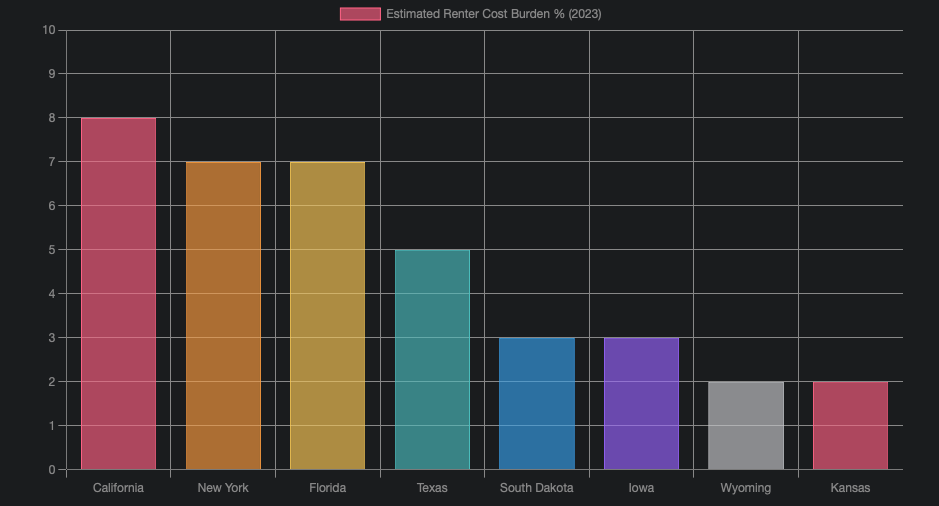
This bar chart illustrates the estimated renter cost burden across various U.S. states in 2023. States like California, New York, and Florida show significantly higher burdens, reflecting their high cost of living, while states such as South Dakota, Iowa, Wyoming, and Kansas exhibit lower burdens, indicating relatively better housing affordability.
The Broader Context of the Housing Crisis
Implications for the Economy and Society
The high rate of cost-burdened renters has far-reaching implications beyond individual household finances. It contributes to increased homelessness, reduced disposable income for other essential needs, and hampers economic growth. When a significant portion of the population is dedicating a large share of their income to housing, it leaves less for savings, investments, and consumer spending, potentially slowing overall economic activity.
The persistent challenge of housing affordability is a critical issue that demands comprehensive solutions. It highlights the need for policies aimed at increasing the supply of affordable housing, implementing measures to stabilize rental costs, and fostering wage growth that keeps pace with living expenses.
mindmap
root[“Housing Affordability Crisis 2023”]
Renter_Burden[“Nearly Half of Renters Cost-Burdened (49.7%)”]
Definition_Cost_Burden[“Spending >30% Income on Housing”]
Definition_Severe_Burden[“Spending >50% Income on Housing”]
Median_Ratio[“Median Income-to-Housing Cost Ratio: 31%”]
Stable_Despite_Rent_Hikes[“Unchanged from 2022 Despite Rising Rents”]
Disparities[“Disproportionate Impact on Vulnerable Groups”]
Lower_Income_Households[“Severely Burdened for Low-Income”]
Racial_Disparities[“Higher for Black & Hispanic Renters”]
Contributing_Factors[“Underlying Causes”]
Housing_Costs_Vs_Wages[“Rising Costs Outpacing Wage Growth”]
Affordable_Housing_Shortage[“Lack of Adequate Supply”]
Regional_Variations[“Geographic Differences”]
High_Cost_States[“California, Florida, New York”]
Lower_Cost_States[“Dakotas, Iowa, Kansas, Wyoming”]
Impacts[“Broader Consequences”]
Economic_Strain[“Reduced Disposable Income & Spending”]
Social_Challenges[“Increased Homelessness Risk”]
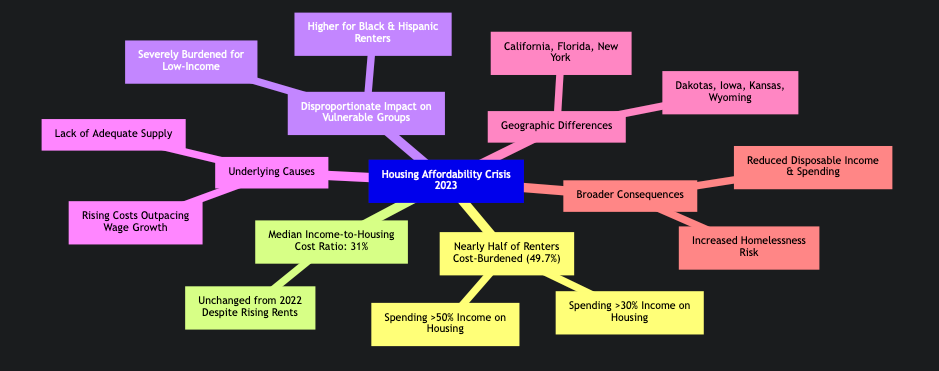
This mindmap provides a structured overview of the housing affordability crisis in 2023. It branches out to cover key aspects such as the definition of cost burden, the median income-to-housing cost ratio, the disparities affecting vulnerable groups, the contributing factors behind the crisis, regional variations in affordability, and the broader societal impacts.
Comparing Renter and Homeowner Burdens
A Stark Contrast in Financial Stability
The affordability crisis disproportionately affects renters. In 2023, while nearly half of renter households were cost-burdened (49.7%), only 27.1% of households with a mortgage faced similar financial strain. This significant difference underscores the greater vulnerability of renters to market fluctuations and economic pressures. The median home price reaching over $428,600 in 2023, more than five times the median household income, further solidifies renting as the default for many, even as its affordability dwindles.
“The Affordable Housing Crisis Is Worse Than You Think” provides a crucial overview of the severe housing affordability challenges facing U.S. renters, emphasizing how a growing number are burdened by high rental costs. It deeply contextualizes the statistics discussed, illustrating the human impact of the crisis and the broader economic ramifications of widespread rental unaffordability.
Key Statistics and Trends: 2023-2025 Outlook
A Snapshot of the Evolving Landscape
The situation in 2023, while concerning, is part of an ongoing trend. Here’s a summary of key statistics and a look at how the landscape has evolved:
| Metric | 2023 Data | Additional Context / Trends |
|---|---|---|
| Cost-Burdened Renters | 49.7% (over 21 million households) | Record high, reaching 22.6 million in 2023. Persisted into 2024. |
| Median Income-to-Housing Cost Ratio | 31.0% | Unchanged from 2022. Broader data shows many renters hitting 42% of pre-tax income by 2024. |
| Severely Cost-Burdened Renters | Approx. 25-26.5% | Spending more than 50% of income on housing. Disproportionately affects low-income households. |
| Renter vs. Homeowner Burden | 49.7% renters vs. 27.1% homeowners (with mortgage) | Renters face significantly higher burdens. |
| Racial/Ethnic Disparities | 56.2% of Black renter households cost-burdened | Hispanic renter households also face higher burdens. |
| Overall Housing Costs vs. Income | Housing costs rising faster than incomes for two decades | Median home price over 5x median household income in 2023. |
This table summarizes the critical metrics and trends observed in the U.S. housing market concerning renter affordability. It highlights the significant number of cost-burdened and severely cost-burdened renters, the persistent median income-to-housing cost ratio, and the stark disparities between renters and homeowners and among different demographic groups.
Frequently Asked Questions (FAQ)
What does “cost-burdened” mean in the context of housing?
A household is considered “cost-burdened” if it spends more than 30% of its gross income on housing costs, including rent and utilities. If a household spends more than 50% of its income on housing, it is categorized as “severely cost-burdened.”
Why did the median income-to-housing cost ratio remain at 31% in 2023 despite rising rents?
While rental costs did increase significantly in 2023, the median ratio remained stable likely due to two main factors: some renters’ incomes keeping pace with rising costs, and/or a shift in the renter population to include more higher-income households. This means that while the average might appear stable, many individual households still faced severe affordability challenges.
Which groups are most affected by the housing affordability crisis?
Lower-income households are disproportionately affected, often facing severe cost burdens. Additionally, certain racial and ethnic groups, such as Black and Hispanic renter households, experience higher rates of cost burden compared to the general population.
How does the renter cost burden compare to homeowners?
Renters face significantly higher rates of cost burden than homeowners. In 2023, nearly half of all renter households (49.7%) were cost-burdened, while a much smaller percentage of homeowners with a mortgage (27.1%) experienced similar burdens.
Are there regional differences in housing affordability across the U.S.?
Yes, housing affordability varies significantly by region. States and metropolitan areas with higher costs of living, such as California, New York, and Florida, tend to have a greater share of cost-burdened renters. Conversely, states in the Midwest and Mountain West, like the Dakotas, Iowa, Wyoming, and Kansas, often exhibit lower cost burden rates.
Conclusion
The data from 2023 unequivocally confirms that the United States is in the midst of a significant housing affordability crisis, particularly for renters. With nearly half of all renter households dedicating over 30% of their income to housing, and the median income-to-housing cost ratio holding at 31%, the financial strain on millions is undeniable. This issue is compounded by stagnant wage growth relative to housing costs, a persistent shortage of affordable units, and disproportionate impacts on vulnerable communities. Addressing this crisis will require multifaceted approaches, including policies that boost housing supply, promote equitable income growth, and provide targeted assistance to those most in need, ensuring that safe and affordable housing is within reach for all Americans.
Recommended Further Reading
- How does housing affordability affect broader economic growth?
- What are the most effective policy solutions to address the U.S. housing crisis?
- What are the evolving trends in rental market dynamics beyond 2023?
- Which states are implementing successful affordable housing initiatives?
Referenced Search Results
census.gov
Cost of Rent and Utilities Rose Faster Than Home Values in 2023 – Census Bureau Data
nlihc.org
Housing Affordability & Cost Burden – National Low Income Housing Coalition
census.gov
nlihc.org
About | National Low Income Housing Coalition
pewresearch.org
The state of affordable housing in the US | Pew Research Center
home.treasury.gov
Rent, House Prices, and Demographics | U.S. Department of the Treasury
census.gov
Share of Income Needed to Pay Rent Increased the Most for Low-Income …
pewresearch.org
The state of affordable housing in the US | Pew Research Center
chamberofcommerce.org
Average Income Needed to Afford Rent – Chamber Of Commerce
zillow.com
Renters: Results from the Zillow Consumer Housing Trends Report …
calbudgetcenter.org
visualcapitalist.com
Charted: The Decline of U.S. Housing Affordability (1967–2023)
nationalequityatlas.org
Housing burden | National Equity Atlas
jchs.harvard.edu
moodyscre.com
Rent-to-Income Ratio Returning to Pre-Pandemic Levels but Senior …
apartmentlist.com
than Half of All Renters Are “Cost-Burdened” According to …
nerdwallet.com
How Much Should I Spend On Rent? – NerdWallet
prb.org
U.S. Housing Cost Burden Declines Among Homeowners but Remains High for Renters | PRB
nar.realtor
Housing Affordability and Supply
usafacts.org
How much do households in the United States spend on rent? | USAFacts
nar.realtor
statista.com
U.S. fixed housing affordability index 2000-2024| Statista
census.gov
Housing Costs a Big Burden on Renters in Largest U.S. Counties
census.gov
More Than 19 Million Renters Burdened by Housing Costs
ncoa.org
Where Can I Turn If I Need Help Paying Utility Bills?
multifamilydive.com
kbtx.com
Survey: Half of Americans spend over 30% of income on housing
novoco.com
census.gov
census.gov
Housing Affordability – U.S. Census Bureau
bondvigilantes.com
The Modern American Dream? – Bond Vigilantes
belonghome.com
The Number of Cost-Burdened Renters Has Hit an All-Time High
apartmentlist.com
The number of cost-burdened renter households has hit an …
payrent.com
House Rules For Renters The Top 10 Essential Rules | PayRent
jasnia.com
Affordable Rent by State – Jasnia
thecanadianpressnews.ca
One-third of renters spend more than 50% of income on rent: survey
eyeonhousing.org
How Rising Costs Affect Home Affordability
reddit.com
30% of gross income on rent? Good rule of thumb or will I be totally …
jchs.harvard.edu
Housing Cost Burdens Climb to Record Levels (Again) in 2023
usatoday.com
Affordable housing statistics: Our 2024 report
content.govdelivery.com
🆕 Nearly Half of Renter Households Are Cost-Burdened, Proportions Differ by Race
dallasfed.org
High inflation disproportionately hurts low-income households – Dallasfed.org
planning.org
Increasing Numbers Of Cost Burdened Renters
usafacts.org
How much do households in Washington state spend on rent?
usafacts.org
How many households in the US spend too much on housing? | USAFacts
huduser.gov
Housing Affordability Across the Country – HUD User
cnn.com
Nearly half of US renters spend more than 30% of their income on …
nahb.org
Housing Affordability Hits Record Low but Turning Point Lies Ahead
statista.com
Gross rent as a share of household income U.S. 2023 – Statista
earnest.com
How Much Should I Spend on Rent? Ignore the ‘30% Rule’ – Earnest
realpage.com
Rent-to-Income Ratios Trend Down in Market-Rate Apartments
moodys.com
30% of income on rent remains the norm in US metros – Moody’s
atlantafed.org
Home Ownership Affordability Monitor
realpage.com
Average Mortgage Payment 90% Higher Than Average Monthly Rent | …
moodyscre.com
Q4 2023 Housing Affordability Update: Rent Burden Lightened for …
rosewood-nursing.com
ca.finance.yahoo.com
One-third of renters spend more than 50% of income on rent: survey
realpage.com
Rent-to-Income Ratios Remain Healthy at 23% in U.S. Apartments …
congress.gov
Housing Cost Burdens in 2023: In Brief
nar.realtor
Housing Affordability Hits Historical Low in August 2023
economist.com
Tracking the cost of Donald Trump’s tariffs | The Economist
themreport.com
Study Examines How Many U.S. Renters Remain Cost-Burdened
cbc.ca
This woman spends 100% of her income on rent | CBC News
forbes.com
Average Consumer Rent Is 42% Of Pre-Tax Income, Report Finds
ipropertymanagement.com
Average Rent by Year (1940-2025): Historical Rental Rates
fred.stlouisfed.org
Housing Affordability Index (Fixed) (FIXHAI) | FRED | St. Louis Fed
jchs.harvard.edu
marylanddigitalnews.com
America’s Fastest Growing Renter Demographic: 55+ Retirees and Empty-Nesters – Maryland Digital News
moodys.com
30% of income on rent remains the norm in US metros
nar.realtor
ctvnews.ca
One-third of renters spend more than 50% of income on rent: survey
nahb.org
Housing Affordability Remains Near Historic Low Level
commerce.nc.gov
Understanding Homeowner and Renter Cost Burden in North Carolina
nlihc.org
Latest State of the Nation’s Housing Report Finds Record …
huduser.gov
Rental Burdens: Rethinking Affordability Measures | HUD USER
pewtrusts.org
American Families Face a Growing Rent Burden | The Pew Charitable Trusts
nahb.org
Nearly 60% of U.S. Households Unable to Afford a $300K Home
nahb.org
jchs.harvard.edu
Renters’ Affordability Challenges Worsened Last Year
econofact.org
Hitting Home: Housing Affordability in the U.S. | Econofact
congress.gov
Housing Cost Burdens in 2023: In Brief
Last updated August 31, 2025