

Bitcoin is exiting a 50-day coil defined by a run to new highs and a controlled pullback. From late August into early October, BTC surged to a new all‑time high near $125,000, then retraced into the low $110,000s by mid‑October amid shifting macro signals and profit‑taking, with intraday prints near the $108,000 area. As of this weekend, price action remains range‑bound with spot levels anchored around the low‑to‑mid $110,000s per recent daily ranges. The setup is tactically constructive: BTC is still trading above its 50‑day moving average and well above the 200‑day baseline according to real‑time technicals, while macro crosscurrents have shifted—U.S. 10‑year yields fell back below 4% on Oct 16, easing a key headwind. Concurrently, the BTC‑gold relationship has tightened, with correlation pushing toward cycle highs as noted in mid‑October analysis, and BTC turned most oversold versus gold in three years, setting up a catch‑up impulse if macro conditions remain supportive.
We provide a decisive 50‑day forecast, the key drivers to watch, and scenario‑based triggers for action.
Where We Are Now: 50‑Day Verification
– Price trend: Rally to ~$125k in early October, followed by a drawdown into the ~$108k–$115k band, per new high confirmation and mid‑October pullback coverage.
– Technical posture: BTC is trading above its 50‑day MA and comfortably above the 200‑day MA, per real‑time moving averages.
– Yield backdrop: After rising into October (with the 10‑year testing the low 4.0%–4.1% zone), U.S. 10‑year yields fell back under 4% on Oct 16, lowering the opportunity cost of holding non‑yielding assets.
– BTC–gold correlation: Correlation has strengthened materially in October, with multiple analyses flagging a push toward prior highs in the relationship as both “hard money” assets rallied; see correlation uptick reports and the positioning signal that BTC became most oversold vs gold in three years.
Technical Indicators: What Matters Most Over the Next 50 Days
– Trend and averages
– 50‑day MA: Acting as dynamic support; price remains above this measure per real‑time moving averages.
– 200‑day MA: Well below spot, confirming an intact higher‑timeframe uptrend.
– Momentum and breadth
– RSI: Overbought pressures have eased to neutral on many dashboards, allowing room for trend continuation without immediate exhaustion per current oscillator reads.
– MACD: The recent pullback compressed momentum; a fresh bullish cross on daily/12‑hour frames would validate the next impulse.
– Levels
– Support: $110,000 (near the 50‑day MA cluster).
– Resistance: $125,000 is the pivotal breakout line; clearing and holding above this zone on strong breadth opens a path to price discovery, consistent with prior commentary on the $125k lid.
Macro Cross‑Currents: Yields, Dollar, and Gold
– U.S. yields: In the first half of the 50‑day window, the 10‑year pushed into ~4.0%–4.1%, with single‑day jumps around 4.05% aligning with risk‑off pressure. The pivot came mid‑October as the benchmark fell below 4%. If yields stabilize under ~4.0%, it’s supportive for BTC; a renewed break above ~4.25% would likely cap upside near‑term.
– Gold linkage: October saw a notable tightening in BTC–gold comovement per correlation analyses. Importantly, BTC became historically oversold vs gold, implying a “catch‑up” tailwind if macro remains benign.
– Risk sentiment: Prediction markets recently assigned roughly even odds of BTC dipping below $100k in the near term—an important contrarian thermometer. This cautions against complacency: macro re‑tightening could quickly pressure the 50‑day MA.
Key Metrics Snapshot
| Metric | Current | Signal | Source |
|---|---|---|---|
| BTC near-term range | ~$108k–$115k | Neutral-to-bullish coil | Recent daily ranges |
| 50‑day MA status | Price above 50‑DMA | Trend intact if held | Real‑time technicals |
| Critical resistance | ~$125k | Breakout trigger | Resistance focus |
| U.S. 10‑yr yield | <4.0% on Oct 16 | Supportive if sustained | Yield dip below 4% |
| BTC–gold relationship | Correlation rising | Tailwind for “digital gold” | Correlation surge |
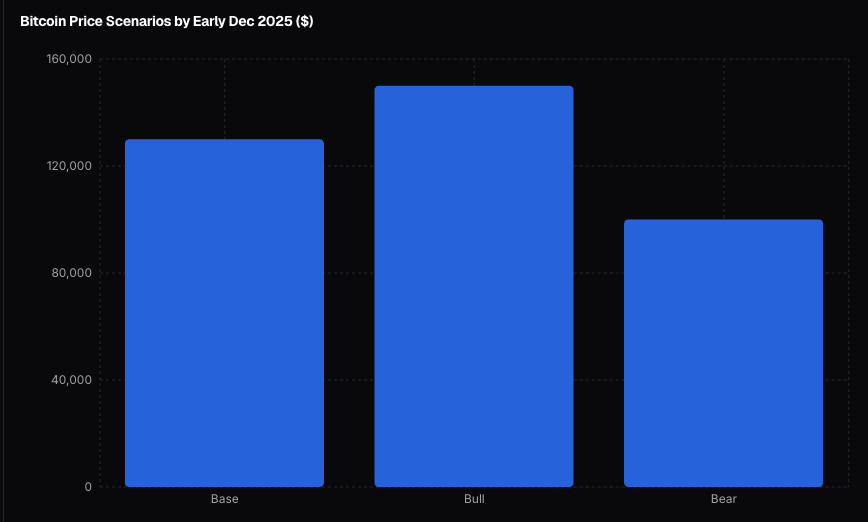
Forecast: 50‑Day Outlook (Through Early December 2025)
Base case (likely): BTC resolves higher out of the range, with a staged move above $125k that carries toward $130k by early December, provided 10‑year yields remain near or below ~4.0% and the BTC–gold correlation stays elevated. The oversold print versus gold from mid‑October adds a “catch‑up” kicker. Confidence: likely.
– First‑order effects: A clean daily close above ~$125.5k on rising volume should draw momentum flows and systematic trend‑followers.
– Second‑order effects: ETF and discretionary inflows re‑accelerate as “digital gold” narrative strengthens; macro hedgers add BTC alongside gold if yields remain subdued.
– Third‑order effects: If BTC sustains above $130k, volatility risk premium compresses and institutional adoption narratives re‑intensify, improving liquidity conditions.
Bear risk (possible but not base case): A hawkish macro surprise pushes the 10‑year back above ~4.25%, reigniting dollar strength and risk‑off flows. BTC would likely lose the 50‑day MA and test $100k psychological support. Confidence: possible.
Bull extension (plausible on breakout/flows): If yields drift toward ~3.8% and breadth remains strong post‑breakout, BTC can overshoot toward $140k–$150k on squeeze dynamics and momentum chasing. Confidence: possible.
Projected Path (Median Trajectory if Base Case Holds)
Reconciliation of Mixed Signals
– Yields vs BTC: The 50‑day period contained both rising yields (early October risk‑off) and a late pivot lower (Oct 16). It is consistent for BTC to have sold off into the yield rise and stabilized as the 10‑year slipped back under 4%. The next move in yields likely determines whether BTC breaks out or re‑tests supports.
– Correlation vs oversold: It is possible to have a high BTC–gold correlation and still observe BTC oversold relative to gold. The former addresses directional co‑movement; the latter compares their relative performance. The mid‑October oversold reading versus gold suggests asymmetry in BTC’s favor if macro stays benign.
Actionable Triggers and Risk Controls
– Confirmation trigger: A daily close above ~$125,500 with expanding volume breadth (spot + futures) is an actionable long confirmation. Confidence: likely bullish continuation if confirmed.
– Invalidation: A sustained daily close below the 50‑day MA (check current MA levels) would negate the immediate bullish setup and put $100,000 re‑test in play. Confidence: possible if U.S. yields re‑accelerate higher.
– Macro monitors:
– U.S. 10‑year yield real‑time level (supportive under ~4.0%): Live quote and context.
– BTC–gold correlation tone: Ongoing correlation coverage and relative value cues from oversold vs gold signal.
– Positioning guidance by profile:
– Investors: Accumulate on dips that hold above the 50‑day MA; scale on confirmed breakout above ~$125.5k. Hedge macro with partial gold exposure while yields are unstable.
– Traders: Trade the range ($110k–$125k) with tight risk until a daily range expansion confirms direction; skew long if yields remain sub‑4.0%.
– Risk managers: Define VaR around the 50‑day MA and $100k psychological; stress for a 4.25%+ 10‑year yield shock and a 7–10% BTC gap‑down scenario.
What Could Change This View
– Upside surprise: Faster‑than‑expected decline in yields toward ~3.8% alongside renewed ETF inflows and persistent high BTC–gold correlation could accelerate the move to $140k–$150k.
– Downside shock: Hot inflation or unexpectedly hawkish Fed rhetoric snaps the 10‑year to >4.25%, the dollar rallies, and BTC loses the 50‑day MA—likely forcing a quick trip to $100k and testing buyer conviction.
– Left‑tail risk: Regulatory surprise or a high‑profile market incident that compresses crypto liquidity would override otherwise favorable macro and technicals.
Definitive Assessment and Predictions
– Through the next 50 days, the path of least resistance is higher, contingent on yields staying near or below ~4.0% and the BTC–gold relationship remaining firm. Expect a breakout above $125,000 and a drift toward ~$130,000 by early December if these conditions hold. Confidence: likely.
– A renewed yield spike above ~4.25% would flip the outlook defensively, making a $100,000 test possible before year‑end. Confidence: possible.
– If yields soften further and momentum breadth expands on breakout, an overshoot toward $140,000–$150,000 becomes plausible on a squeeze. Confidence: possible.
These projections integrate the 50‑day technical structure (50‑DMA support, $125k resistance), the yield regime shift back under 4%, and a strengthening “digital gold” correlation supported by BTC’s oversold posture versus gold. For decision‑makers, the most important operational levers are: respect the 50‑day MA as the tactical line in the sand, treat $125.5k as the go/no‑go breakout trigger, and anchor macro risk to the 10‑year yield’s 4.0%/4.25% thresholds.
Wichtiger Risikohinweis
Die auf dieser Website enthaltenen Informationen dienen ausschließlich zu Informationszwecken und stellen weder eine Anlageberatung noch eine Empfehlung zum Kauf oder Verkauf von Finanzinstrumenten dar. Jede Investition in Wertpapiere und andere Finanzprodukte ist mit erheblichen Risiken verbunden. Frühere Wertentwicklungen, Simulationen oder Prognosen sind kein verlässlicher Indikator für die zukünftige Wertentwicklung. Es besteht die Möglichkeit eines Totalverlusts des eingesetzten Kapitals.
Prognosis for the Coming Days (October 19–23, 2025)
- Bearish Scenario (Linear Trend Extension): Based on a linear regression fitted to the last 10 trading days, Bitcoin could continue its decline, potentially testing support levels around $100,000–$105,000 by October 23. This assumes sustained selling pressure without major catalysts.
- Bullish Scenario (Rebound Potential): Contrasting the linear model, recent oversold signals and expert analyses point to a possible reversal. If BTC holds above $106,000 and breaks $108,500, it could rally toward $111,500–$112,200 in the near term, with optimistic targets reaching $124,000 by late October or even $135,000 on a strong bounce. A “black swan” event over the weekend (October 18–19) could accelerate volatility, either downward or as a buying opportunity.
- Overall Outlook: Neutral to cautiously bullish. Monitor key resistance at $110,000 and support at $105,000. Broader predictions for October place BTC in a $104,000–$121,000 range, with potential ROI up to 15.5% from current levels if positive momentum builds.
The chart below illustrates the historical prices (solid blue line) alongside the bearish linear forecast (dashed red line) for the next 5 days.
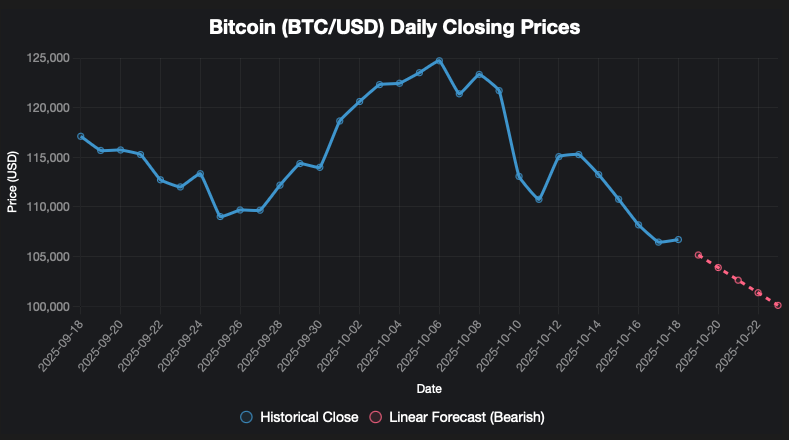
The Chart shows Bitcoin (BTC/USD) daily closes from 2025-09-18 to 2025-10-22 with two series: historical closes (blue) through 2025-10-18 and a short linear forecast (pink dashed) projecting a continued decline to around 100k by 2025-10-22. – Key pattern: a rally into early October (peak ~124k), then a steady decline into mid-October (~106k on 2025-10-18), with the linear model projecting further downside.
Haftungsausschluss
Die Inhalte dieser Website wurden mit größtmöglicher Sorgfalt erstellt. Wir übernehmen jedoch keine Gewähr für die Richtigkeit, Vollständigkeit und Aktualität der bereitgestellten Informationen. Haftungsansprüche, die sich auf Schäden materieller oder ideeller Art beziehen, welche durch die Nutzung oder Nichtnutzung der dargebotenen Informationen bzw. durch die Nutzung fehlerhafter und unvollständiger Informationen verursacht wurden, sind grundsätzlich ausgeschlossen.
Externe Links
Auf die Gestaltung und die Inhalte verlinkter Websites haben wir keinen Einfluss. Wir distanzieren uns hiermit ausdrücklich von allen Inhalten aller auf unserer Website verlinkten Seiten.
Grundlage der Anlageentscheidung
Alleinverbindliche Grundlage für eine Anlageentscheidung sind die offiziellen Verkaufsdokumente wie der Verkaufsprospekt und die wesentlichen Anlegerinformationen (Key Investor Information Document, KIID), die kostenlos beim jeweiligen Emittenten oder uns erhältlich sind.
Sources (167)

https://finance.yahoo.com/quote/BTC-USD/history/

https://www.investing.com/crypto/bitcoin/historical-data

https://charts.bitbo.io/price/

https://twelvedata.com/markets/499377/crypto/coinbase-pro/btc-usd/historical-data

https://coinmarketcap.com/currencies/bitcoin/historical-data/

https://www.investing.com/crypto/bitcoin/btc-usd-historical-data

https://ycharts.com/indicators/bitcoin_price

https://www.statmuse.com/money/ask/btc-price-last-365-days

https://www.statista.com/statistics/326707/bitcoin-price-index/?srsltid=AfmB